LeanProfiler
Suppose a source indexer that normally finishes in ten seconds suddenly needs thirty. A stopwatch
confirms the slowdown, but it cannot say whether discovery, parsing, analysis, or writing changed.
Lean's compiler profilers are excellent when elaboration is the problem; here, however, elaboration
has already ended and the interesting work begins inside main.
LeanProfiler fills that gap. The running program names the phases that matter to it: a file indexer
might record source.discover, source.parse, and index.write, while a server might record
request parsing, lookup, and serialization. The trace keeps their nesting, threads, metadata,
elapsed time, and Lean heartbeats. A separate summary groups repeated work, making it possible to
compare two runs without reading a long timeline by hand.
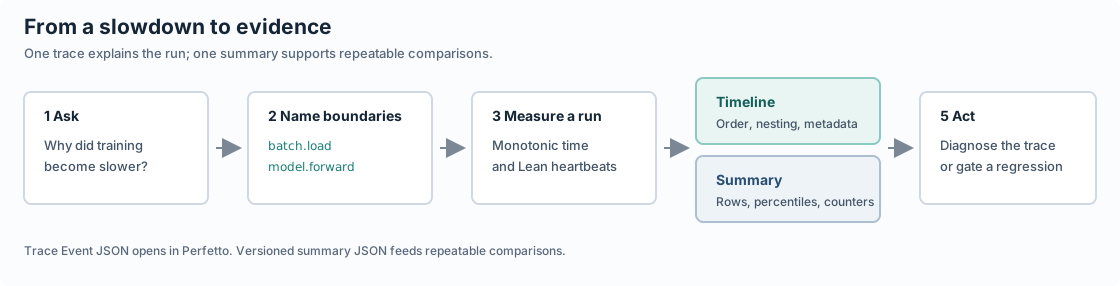
The guide follows a small source indexer that reads and analyzes three files. We capture it, follow one span all the way into the report, distinguish self time from total time, slow down the analysis phase, and compare the resulting summaries. The checked-in artifacts come from real executions; their exact durations belong to the machine and run that produced them.
This is a runtime profiler. If a theorem is slow to elaborate, use Lean's compiler and elaborator profilers. If code inside a foreign boundary is slow, use that runtime's profiler for lower-level detail. The outer LeanProfiler span still shows how long the Lean caller waited and where that call belongs in the rest of the run.